 |
A fuzzy logic C++ library
|
 |
A fuzzy logic C++ library
|
These plots are produced with gnuplot from a data file and a command files produced through this library. See SLIFIS::Generate3DPlot(). The samples here are programmatically built, and the plot are generated by makefile (make doc).
Please note that doing this does not require the graphical API (Slifis Graphical API for plotting) and the needed backend library, as the graphical part is handled by gnuplot.
The first figure is a 3D view of the "tipping" problem, as described in demo-tipping.cpp
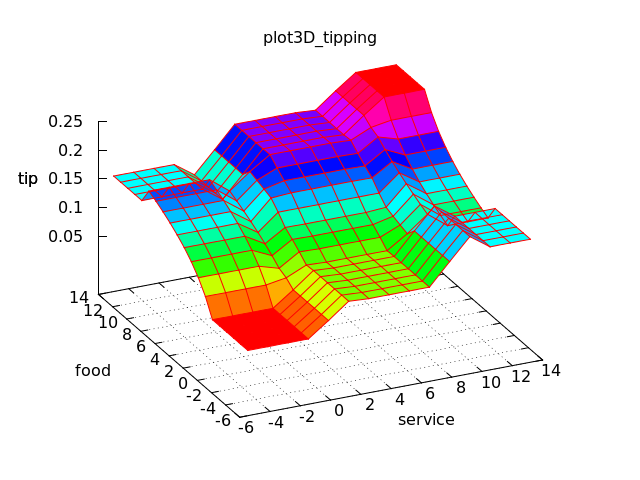
The plot gives a graphical representation of the following rule base, generated by demo-tipping.cpp:
-------------------------------------
Rule base :
-------------------------------------
 - Nb of rules: 3
 - Avg degree=1.000, Min=1.000 Max=1.000
  # :
  1 : IF service IS poor OR  food IS rancid THEN tip IS cheap (degree=1.000)
  2 : IF service IS good THEN tip IS average (degree=1.000)
  3 : IF service IS excellent OR  food IS delicious THEN tip IS generous (degree=1.000)
-------------------------------------
The next example is a 3D view of the "shower" problem: given water pressure and temperature as inputs, when is comfort the best ? See demo file demo-shower.cpp, that produces the data and commands used for this plot.
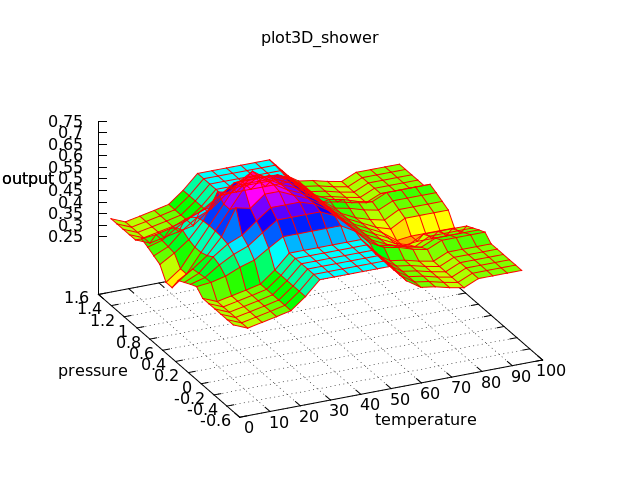
The plot gives a graphical representation of the following rule base, generated by demo-shower.cpp:
-------------------------------------
Rule base :
-------------------------------------
 - Nb of rules: 6
 - Avg degree=1.000, Min=1.000 Max=1.000
  # :
  1 : IF temperature IS Cold THEN output IS Very Bad (degree=1.000)
  2 : IF temperature IS Hot THEN output IS Bad (degree=1.000)
  3 : IF temperature IS Too hot THEN output IS Very Bad (degree=1.000)
  4 : IF pressure IS Low THEN output IS Bad (degree=1.000)
  5 : IF pressure IS High THEN output IS Bad (degree=1.000)
  6 : IF temperature IS Warm AND pressure IS Fine THEN output IS Good (degree=1.000)
-------------------------------------
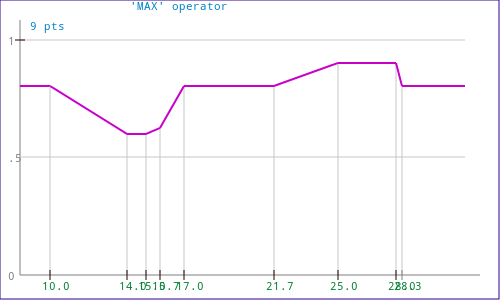
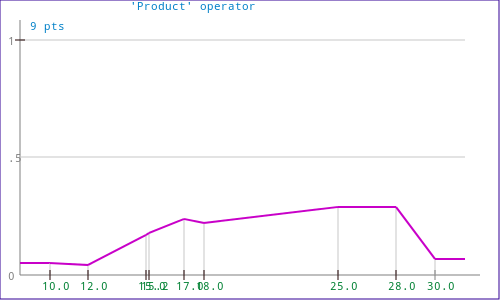
These plots show examples of applying the classical OR, AND or PRODUCT to fuzzy membership functions. For more on plotting, see Slifis Graphical API for plotting.
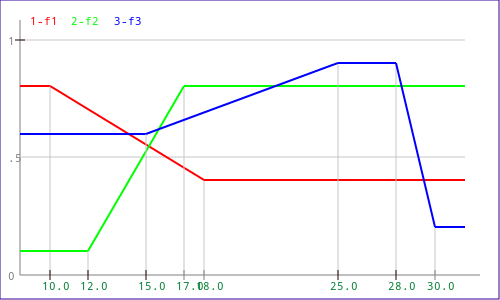
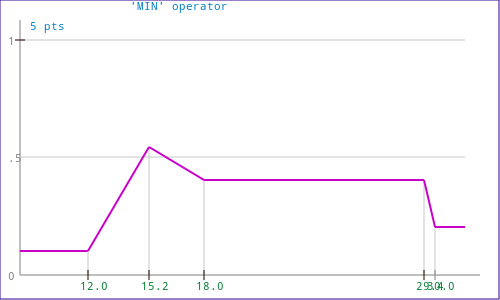
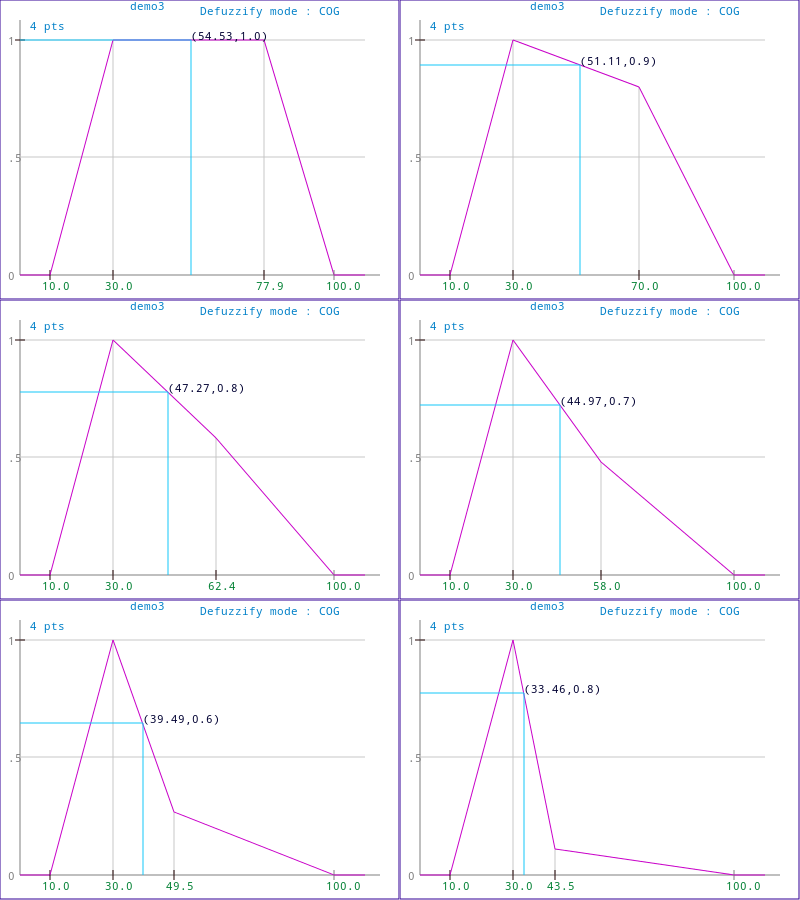
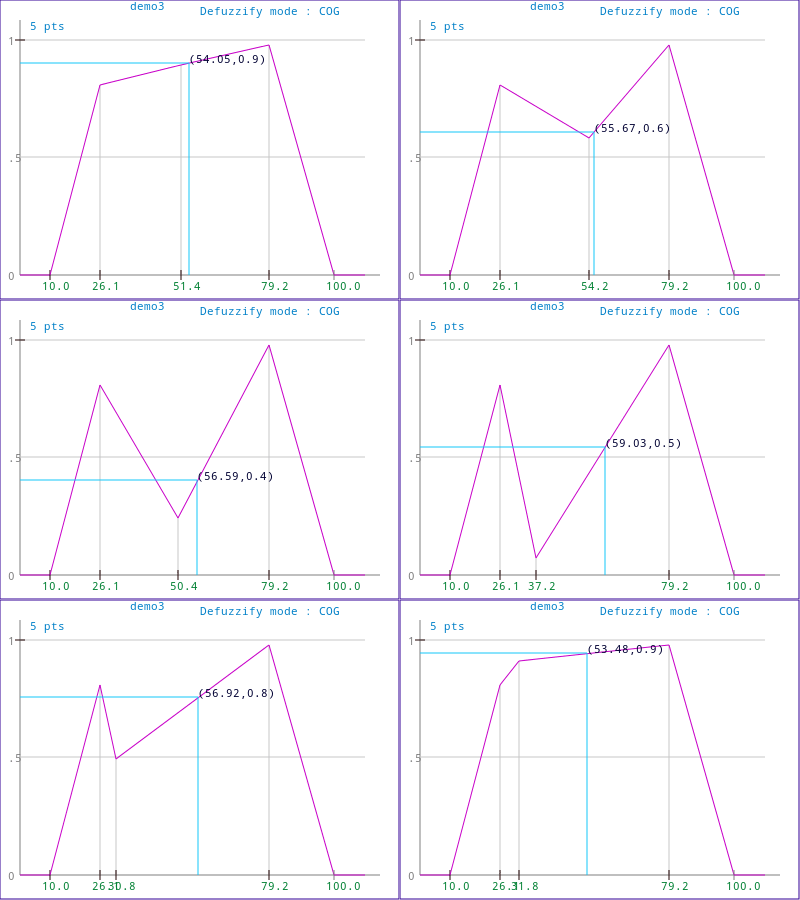
Here, two animated gifs produced with the included demo3.cpp app, and showing the defuzzyfied value for a simple membership function when a point moves around.
These plots were produced with demo2.cpp
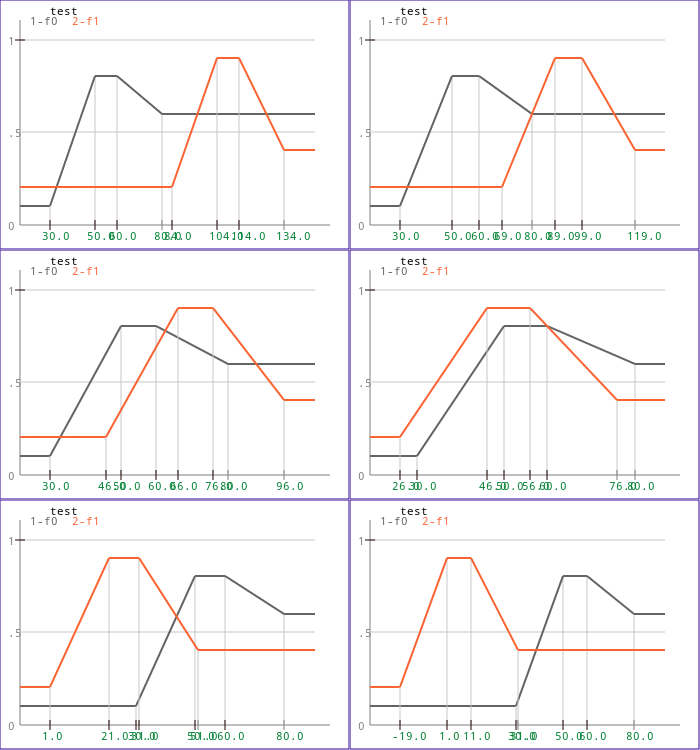
Membership functions defining two fuzzy sets | 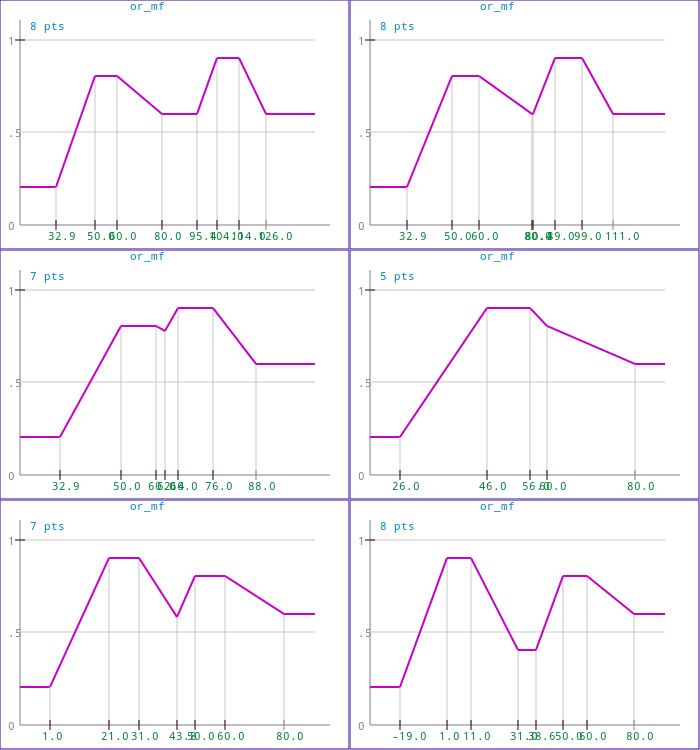
Corresponding "MAX" operation |

Corresponding "MIN" operation | 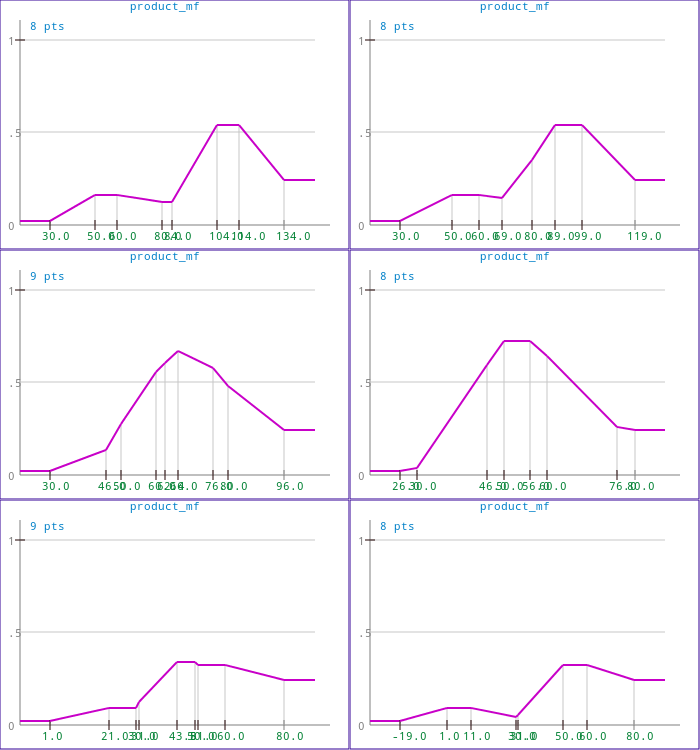
Corresponding "product" operation |
 1.7.6.1