|
A fuzzy logic C++ library
|
|
A fuzzy logic C++ library
|
This page describes the plotting and windowing API that comes with the Slifis library.
Content:
This API is included as a separate library that builds on top of slifis, and that has its own namespace (see slifis_plot). It can be used in user programs to generate plots of fuzzy stuff that you can show on screen or save in a file. It builds on top of a back-end graphical library, that is required both to compile and to run (see Build options). User applications will need to link with lib_slifis.a AND with lib_slifis_gapi.a
It is NOT designed to build full scale GUI programs but must be thinked as a quick way to build a prototype or validate some fuzzy logic application. For full featured GUI applications, you need to turn toward a more general libraries.
All examples in the documentation (and the Screenshots) are generated using this library.
This API is made of two parts (see namespace slifis_plot for a complete list):
To use this part of library, you need to include in your .cpp files:
#include "slifis_gapi.hpp"
(This will automatically include the file slifis.hpp).
Four classes are provided to the user:
All four are inherited from the private virtual class PLOT, while the two first are inherited from private class PLOT_FUZZY (see class hierarchy). All these classes only use the set of provided functions for drawing, making them independent of the underlying graphical back-end library.
The provided set of functions is generic, and is not at all related specifically to fuzzy concepts. This part of the api is dedicated to
This enable building application with a very basic graphical user interface. All these functions have a name that follows the pattern "GAPI_XXXX()".
This API is built as an abstraction of the used graphical library. All the needed requirements can be seen in the files gapi_glue.hpp and gapi_glue.cpp. Currently, it uses Cairo and GTK+2 Other back-end engines could be provided in the future (opencv was used in previous version, due to legacy considerations).
The following examples only apply to membership functions plots and sets of membership functions plots.
Say you have a membership function mf, that you want to draw in an image and save that image on disk.
All you need to do is:
This is demonstrated in the following code:
        MEMBFUNC mf;
// fill mf with something...
        ...
        PLOT_MF p( mf );        // create the plot, and assigns the membership function to it
        p.Draw();                       // Draw !
        p.Save( "my_mf.png" );
Of course, function is not statically copied into plot object, only a link is established. So if the function is modified, the plot will reflect these, as soon as you call the "Draw()" function.
For a set of functions, it's not really different :
        FUZZY_IN fs;
// fill fs with something...
        ...
        PLOT_FS p( fs );        // create the plot, and assigns the set of functions to it
        p.Draw();                       // Draw !
        p.Save( "my_set.png" );
Say you have a membership function mf, and you want to show it on screen. Besides creating the plot as previously, you need to:
If you miss this last point, then the window will disappear as soon at it was opened...
This is demonstrated in the following code (it works the same for a plot of a set of functions):
        GAPI_CreateWindow( "my_mf" ); // create window
        MEMBFUNC mf;
// fill mf with something...
        ...
        PLOT_MF p( mf );        // create the plot, and assigns the membership function to it
        p.Draw();                       // Draw !
        GAPI_ShowImage( "my_mf", p.GetPlotImage() );  // show on screen in window "my_mf"
        GAPI_WaitKey();                               // wait for keystroke
You can open as many windows as you want, as soon as they have different names.
If the plot will always be shown on the same window, then you can simplify code by assigning the window name to the plot:
PLOT_FS p( fs );
p.AssignWindow( "fuzzy plot" );
This way, updating the window just reduces to a single line, instead of:
p.Draw();
GAPI_ShowImage( "fuzzy plot", p.GetPlotImage() );
just write:
p.Show();
One you have opened one or more windows, you can enable user interaction, using keyboard and mouse input.
The keyboard input is handled through the GAPI_WaitKey() function: it returns the ASCII code of the key, that you can test in a loop. For instance;
        GAPI_CreateWindow( "my_mf" ); // create window
        MEMBFUNC mf;
// fill mf with something...
        ...
        PLOT_MF p( mf );        // create the plot, and assigns the membership function to it
        p.AssignWindow( "my_mf" );
        char key;
        do
        {
                p.Show();
                key = GAPI_WaitKey();                         // wait for keystroke
                switch( key )
                {
                        case 'a':... // do something on mf
                        break;
                        ...
                        default:
                }
        }
        while( key != 27 ); // while ESC is not hit
For mouse handling, you need to provide to each window that requires it a callback function. This function will be called at every mouse event while the GAPI_WaitKey() function is active.
The callback function must have the following signature:
void MyMouseCallback( int event, int x, int y, int flags, void* param );
Assigning the callback to the window is done with the following call:
GAPI_AssignCallback( "myWindow", MyMouseCallback );
The callback function can identify event types, for instance:
void MyMouseCallback( int event, int x, int y, int flags, void* param )
{
        if( event == GAPI_EVENT_MOUSEMOVE )
        {
                ... // do something
        }
        if( event == GAPI_EVENT_LBUTTONDOWN )
        {
                ... // do something else
        }
}
You can also pass a parameter of any type (well, a pointer on a parameter, actually), that can be used in the mouse callback:
MyParamType myParameter;
GAPI_AssignCallback( "myWindow", MyMouseCallback, &myParameter );
This way, in the callback, you can fetch this parameter, as in the following code:
void MyMouseCallback( int event, int x, int y, int flags, void* param )
{
   MyParamType* myParameter = static_cast<MyParamType*>(param);
   someType someValue = myParameter->value1;
}
Sure, you can also use classic 'C' casts, as in:
MyParamType* myParameter = (MyParamType*) param;
When creating a plot as shown before, a default size is used (see SLIFIS_PLOT_DEF_W and SLIFIS_PLOT_DEF_H). However, you can define your own size at creation time:
        ...
        PLOT_MF p1( mf1, 800 ); // create the plot for mf1, of width 800, and default height
        PLOT_MF p2( mf2, 300, 200 );    // create the plot for mf2, of size 300x200
        ...
You can change plot size after creation, using the function PLOT_FUZZY::Resize( int w, int h ), like in the following example:
        ...
        PLOT_MF plot( mf1 );            // create a plot with default size
        plot.Resize( 800, 200 );        // resize it
        ...
The default behaviour is to have "auto-scaling": the scale is automatically computed so the whole function or set of functions fits on the plot. This can sometimes not be desired, so you can switch to manual scaling mode. This means that it will be mandatory to assign a scale before drawing, EXCEPT if you have allready draw once the plot. In that case, the plot will use the previous scale.
For example, say you want to edit a function, and plot it with always the same scale, in order to visually see editing. But beware, the scale is computed only at drawing time, so you need to draw it once to get the scale.
The code below illustrates this:
        PLOT_MF p( mf );
        p.Draw();       // initial scale computing
        p.SetAutoScale( false );
        do
        {
                ... // Edit mf
                p.Draw();       // draw whilst keeping original scale
        }
        while( whatever );
You can also assign to a plot the scale of another plot (even of different type):
        PLOT_MF p1( mf1 );
        p1.Draw();      // initial scale computing
        PLOT_SCALE s = p1.GetScale();

        PLOT_MF p2( mf2 );
        p2.SetAutoScale( false );
        p2.SetScale( s );
        p2.Draw();
Both types of fuzzy plots provide a selection feature, to visually enhance something on the plot.
Several options can be individually selected for these types of plots, you can :
You can also draw any point on plot, using the function PLOT_FUZZY::DrawPoint()
A mechanism for applying these options to all the plots in memory is provided, through a singleton pattern (static instance of class PLOT_DATA). This class holds an instance of class PLOT_COLLECTION, that itself holds all the created plots (actually, only a pointer on the plots).
This can be used to apply an option to all the plots of your app with a single line. At present, the following can be done on all plots:
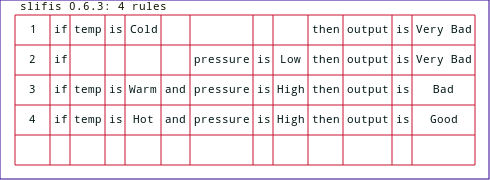
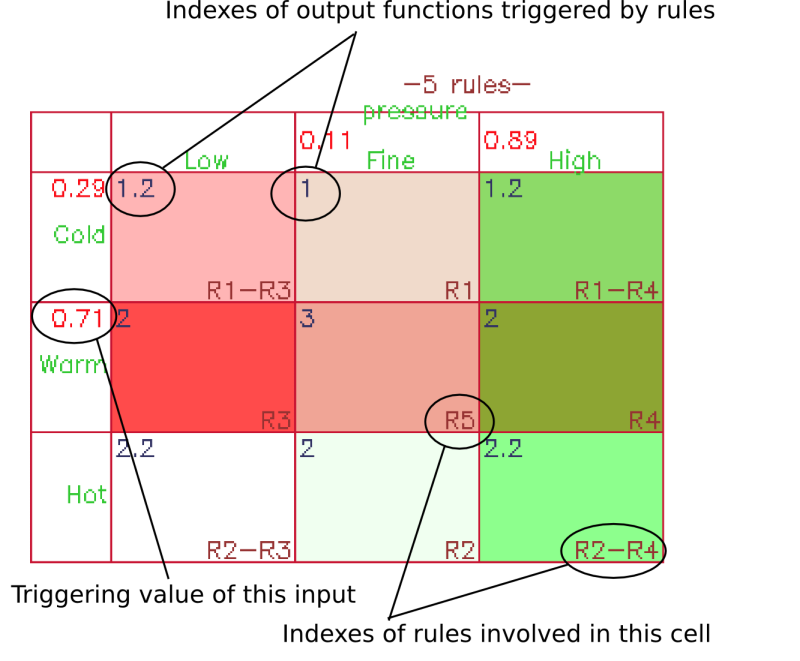
Two types of plots are provided for the rule base, general text-type plots, that show the rule base in a classical table view. For two-inputs FIS, a second plot type is provided, that shows the rule base as a table view with the inputs vertically and horizontally.
This plot shows the rule base (class slifis::RULE_BASE) in a classical text view. Its implementation is in class PLOT_RB_TEXT.
An example of such a plot is given below:
Additionally, some code is provided to seek symbolic information on what type of cell corresponds to a given (x,y) position in the plot. This is of course mainly useful in a mouse callback function, see as example application try-fis.cpp. This is implemented through PLOT_RB_TEXT::GetPositionInfo() that returns a type POSITION_INFO, given a pair of (x,y) values.
The plot is handled through the class PLOT_RB_2D. It is suitable only for FIS with two inputs. A good example of this type of plot is used in the try-fis.cpp application, when feeding it with a 2-input FIS:
The PLOT_FUZZY::Draw() function first checks the scale : if on 'AutoScale' mode then it tries to recompute it, and if unable, it checks if a previous scale is available. If not it returns false.
Then, it paints the background, draws the axis, prints out the caption, and finally call the private virtual function P_DrawPlot(). Depending on the nature of the plot (PLOT_MF or PLOT_FS), two different functions will be called.
See file plot_private.hpp
 1.7.6.1